writing / college football
How well do College Football Transfers Make the Jump?
Analyzing over 500 players who made the jump from the Group of Five to the Power Five: who keeps their snaps, whose grades hold, and what that means for evaluating the portal.
The transfer portal has completely changed college football. Roster building used to take years; now, programs flip their talent level overnight. But as easy as it is to get lost in the hype around “portal winners,” not every move pans out the same way.
I wanted to see what really happens when players move up a level, not the headline transfers, but the whole picture. I tracked ~530 Group-of-Five players who transferred to Power-Five programs between 2022 and 2024 to examine the relationship between playing time and performance.
I pulled the data in R, built a master CSV of every transfer, and then manually added Pro Football Focus grades and snap counts for each player’s first year at their new school. The goal was straightforward: to determine what truly carries over when talent advances a level: what remains, what diminishes, and what implications this has for assessing portal fits.
Usage
Among roughly 530 Group-of-Five players who moved to Power-Five programs between 2022 and 2024, three out of four saw their snap counts drop. The median player lost about 160 snaps, and one in five logged fewer than 100 snaps at their new school. The decreased workload doesn’t tell the complete story, as Power 5 teams generally have more depth; however, the sheer drop in snaps for some players makes for an interesting data point.
Playing Time Rarely Transfers
Three out of four G5 players see their snap counts drop after moving up
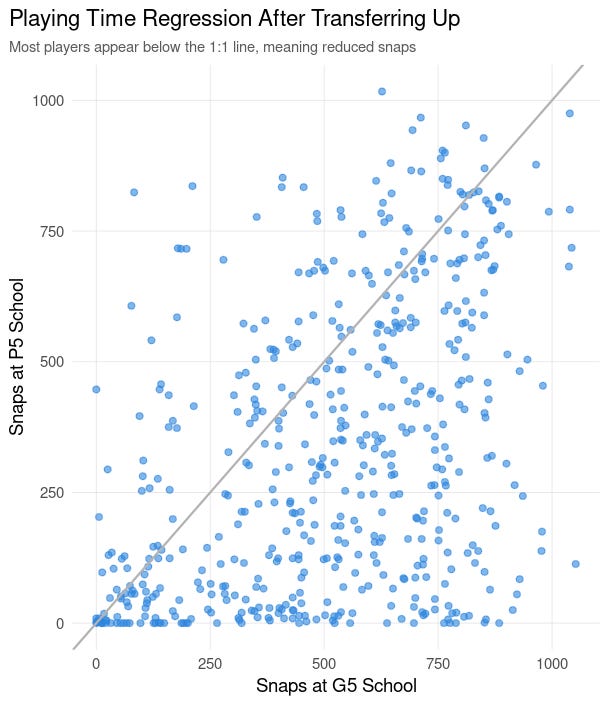
Each point represents one player’s snaps before and after transferring. The gray line marks equal usage between levels; players above it gained playing time, while those below lost it. Most of the players sit below the line, showing that their isn’t much consistency from G5 to P5 in terms of players getting the same snaps. There’s no exact science to predict the snap-differential as a variety of factors including: injuries, depth, scheme-fit, and the ability for different players to learn and execute their new system at game speed would factor into their drop or increase in playing time.
Position Groups
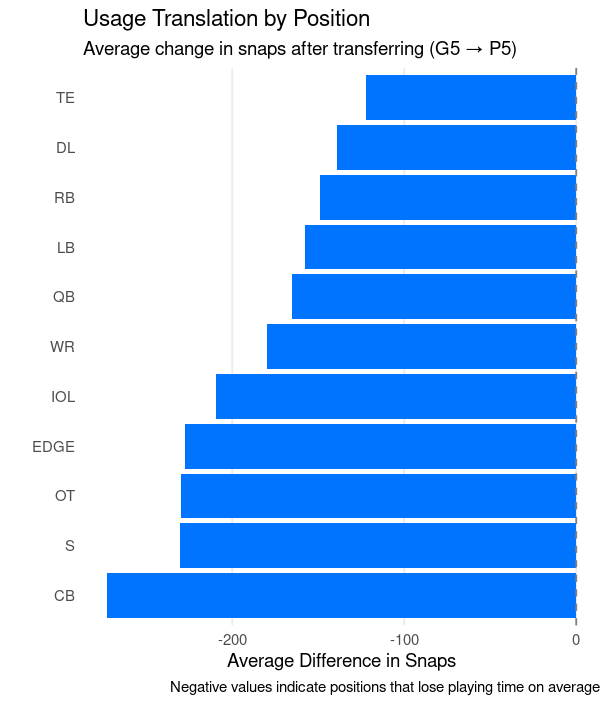
Every position group lost playing time on average, but the drop-off wasn’t uniform. Tight ends, defensive linemen, and running backs translated best, retaining larger portions of their previous workloads. On the other end, cornerbacks, safeties, and offensive tackles experienced the steepest declines, often more than 200 snaps below their G5 totals.
Playing time is the easiest thing to measure, and it’s the first thing that usually fades. But what about the players who do get on the field, how well do they actually play once they’re there? The next step part of my analysis looks at performance itself, and whether production translates any better than opportunity using Pro Football Focus Data.
Performance
Playing time is one thing, but performance tells a different story. Once players are on the field, the real question isn’t how much they play, but whether they can maintain their level of performance. Moving up doesn’t just test a player’s size or speed; it tests how well their production holds when almost every rep in conference-play comes against top-end competition.
Performance Slips, but Doesn’t Collapse
Nearly 40 % of G5 transfers see clear PFF declines, while only one in five improve, however most hold steady or regress slightly.
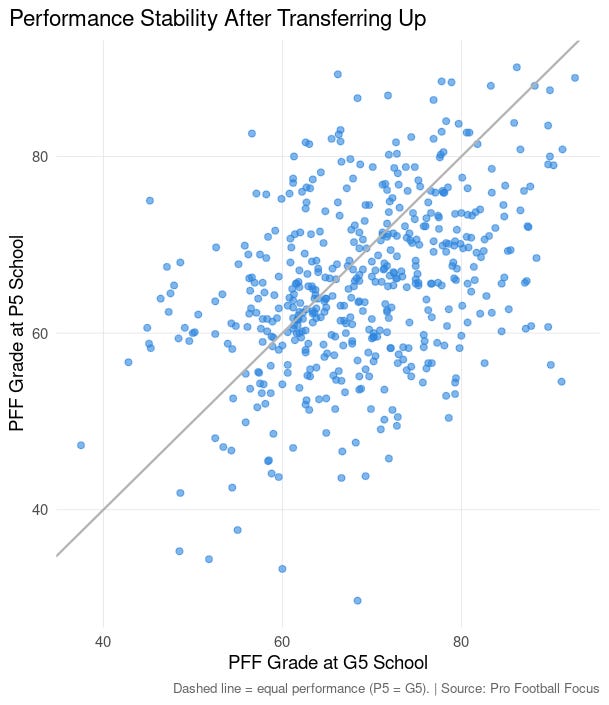
Each point represents a player’s PFF grade before and after transferring up. The diagonal line marks equal performance between levels, players below it graded worse at the Power Five level, while those above improved. Most of the data hugs the line but tilts slightly downward, indicating that their grades generally hold up but rarely improve.
Across all ~530 players, grades were moderately correlated (r ≈ 0.40). That means past performance still matters, good players tend to stay good, but dominance at the G5 level doesn’t always scale up. A player who looked unstoppable in the MAC might still be talented, but the windows are tighter and the defensive lines are faster in the Big 10.
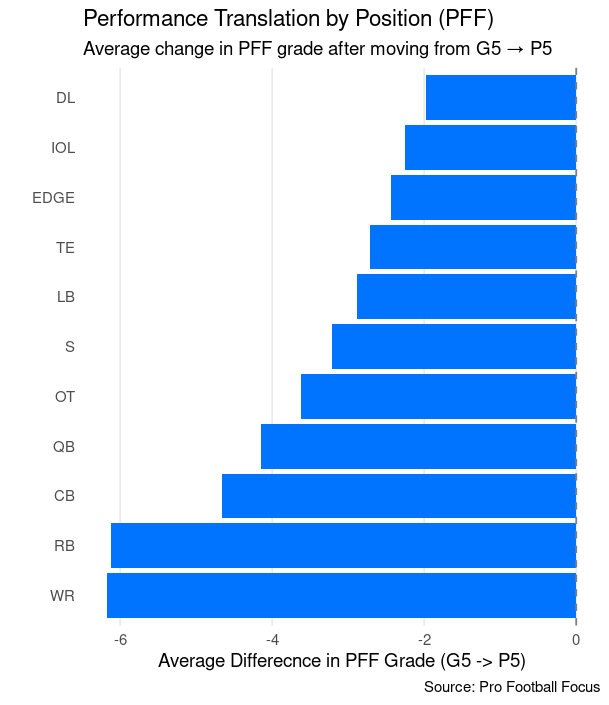
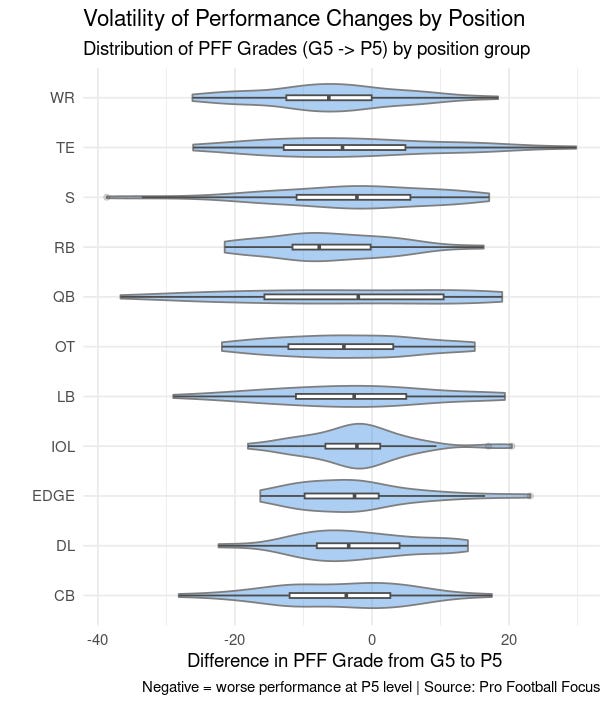
Not every position takes the same hit. Wide receivers and running backs show the largest performance dips, averaging a five-to-six-point drop in PFF grade. Interior linemen and defensive linemen hold up best, showing minimal decline. And when you look at volatility, how wide the range of outcomes is, it tells the same story. Skill positions are boom-or-bust. Trench players? They’re much more steady.
For staffs and fans evaluating portal talent and their recent portal hauls, that matters. Production in the trenches tends to travel. Production in space, not as much.
Most players don’t crater after transferring up; they regress to the mean. A few break out, a few disappear, and the majority land somewhere in between. Playing time shrinks, performance dips slightly, and the players who hold up best are usually the ones who already had the size, strength, or skill set to compete at a Power-Five pace. If there’s one lesson from the data, it’s this: talent moves, but context doesn’t. Coaches can evaluate the numbers, but a player’s fit into a new system, speed, and expectations will always play a crucial role in determining whether a player from Northern Illinois can replicate his level of production as an Oregon Duck.
First published on Substack. Republished here in full.
About the author: Gardner Thornhill is an analytics engineer and data analyst who builds data pipelines, predictive models, and interactive visualizations. Explore his case studies and other articles.