writing / elections
What 2,425 Precincts Tell Us About the 2026 Special Elections
A hand-built dataset of 2,425 precincts across 32 special elections in 13 states, compared with the 2024 presidential vote, the generic ballot, and presidential approval on election day.
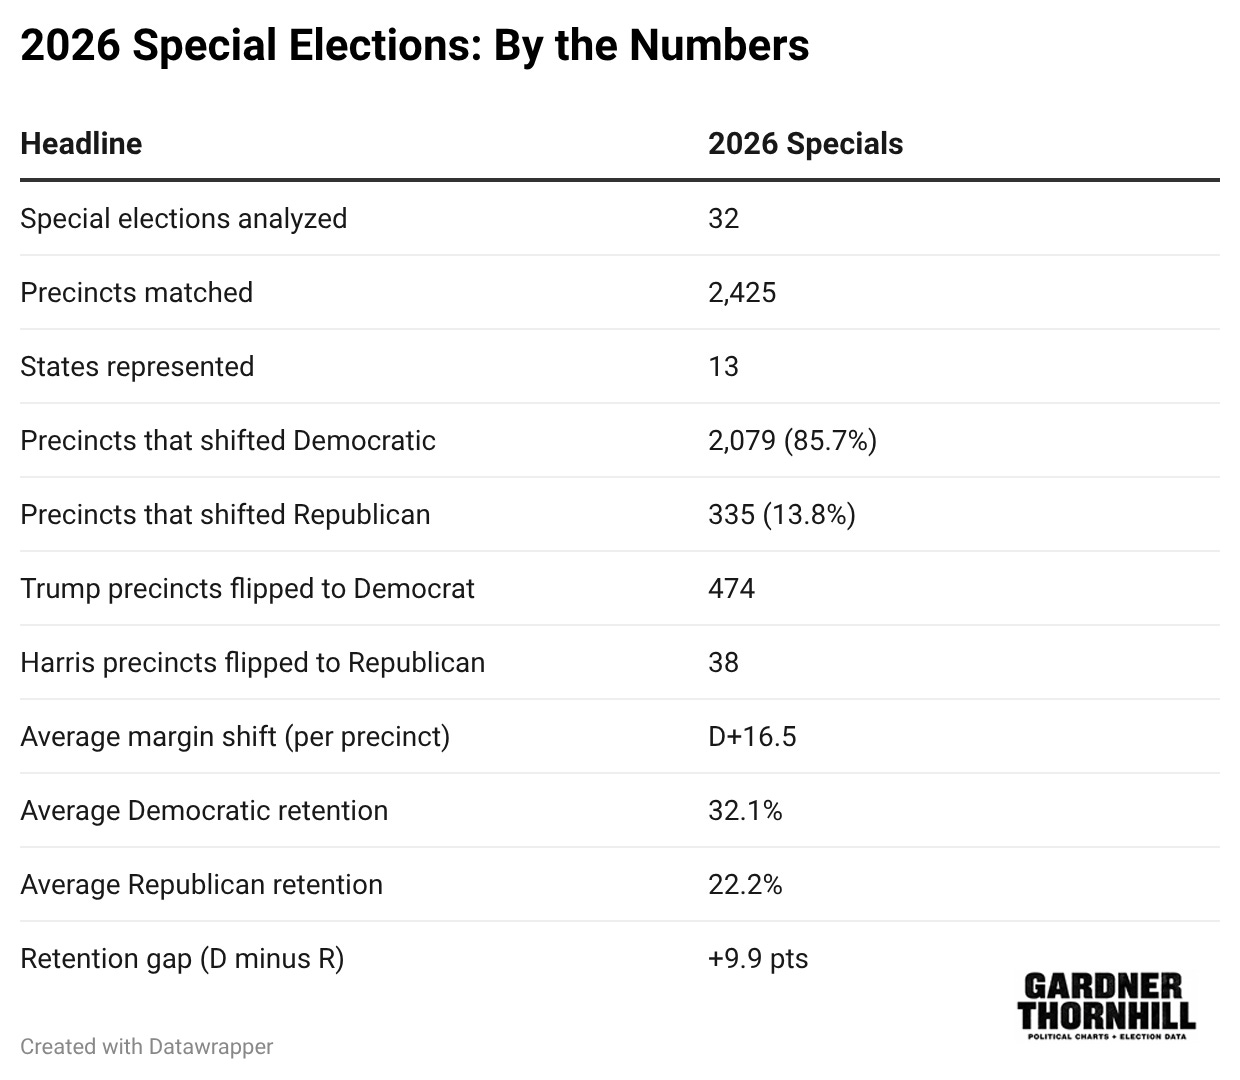
My interest in special elections began after I noticed a few accounts posting about the 2025 Special Elections. As someone who loves elections, I quickly became hooked. I bookmarked Ethan Chen (@ECaliberSeven on X/Twitter’s) Google Sheet, which tracks every special election and includes an enormous amount of district-wide special election information that anyone interested in the subject should check out!
Using Ethan’s sheet as a guide, I started researching precinct-by-precinct results on Special Election days to see how a certain candidate was performing relative to the 2024 Presidential Election. I became fascinated by the shifts in margin and turnout at the precinct level and after countless hours of matching precincts, cleaning election results spreadsheets, and a fair amount of manual data entry, I have put together a massive precinct dataset that contains: The Date of the Special Election, Precinct Names, Special Election Democratic and Republican Party Votes, 2024 Presidential Votes for Kamala Harris and Donald Trump, and then using Vote Hub’s Generic Ballot Poll Tracker and Donald Trump’s Approval Rating at the time of each election, I was able to make valuable insights across ~2,400 precincts, 32 Elections, and 13 States.
Where are the Flips Happening?
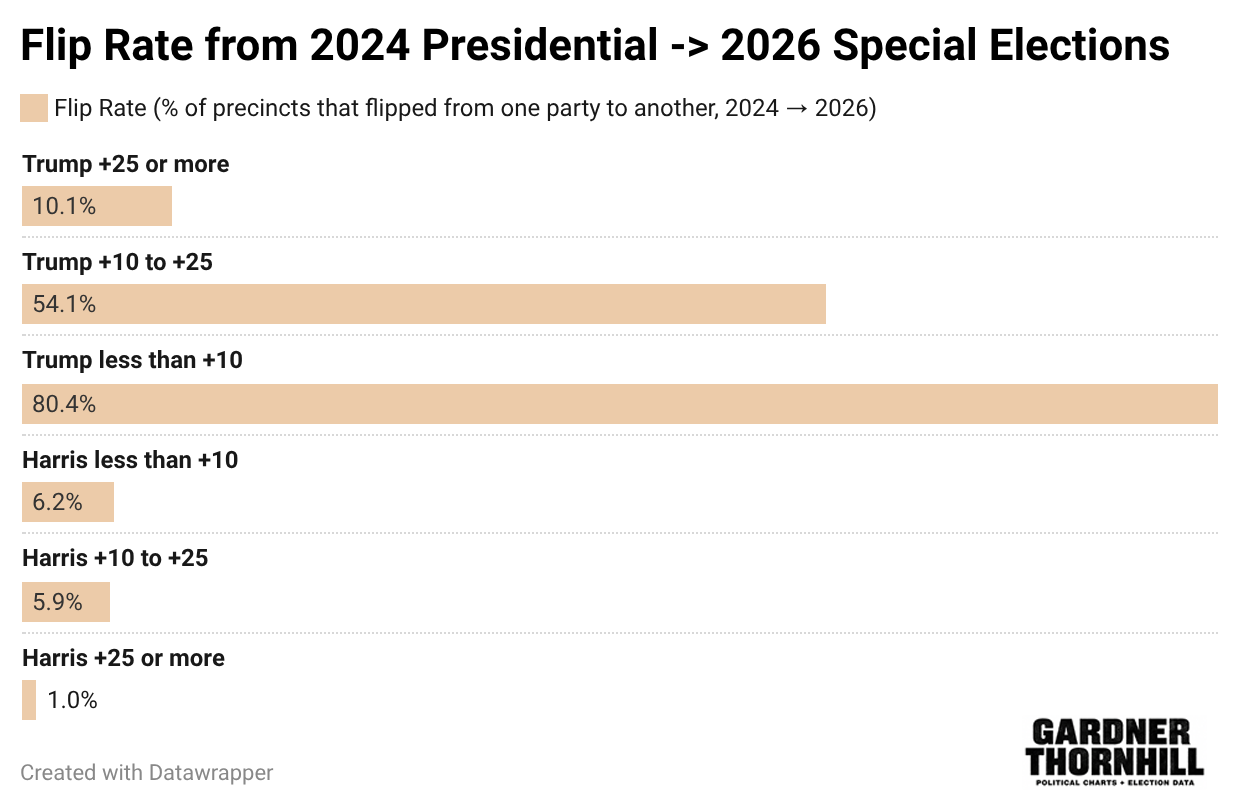
Democrats are performing well in special elections this year, as expected, given the variety of factors and fundamentals in their favor. In my analysis, the precincts that flipped the most from Donald Trump to a Democratic Candidate in a special election were those that Trump won by less than 10% in the 2024 election. Completely expected when you consider the environment and the turnout advantage that Democrats now enjoy in special elections. However, beyond Trump +10%, the Democrats are still flipping precincts to their party.
The Democratic Candidate in special elections have flipped 54% of precincts that Trump won by 10-25% over Kamala Harris, and to put this into perspective, that large of a shift would be able to flip every competitive state in the 2024 election, and then put states like Montana (Trump +20), Kansas (Trump +16), Alaska (Trump + 13), Ohio (Trump +11), Texas (Trump +14), and Iowa (Trump +13) in play. It is important to note that the shifts will almost certainly not be as large in November, but it’s worth illustrating just how well the Democrats have been doing in Special Elections in 2026.
Democrats are Showing Up Everywhere
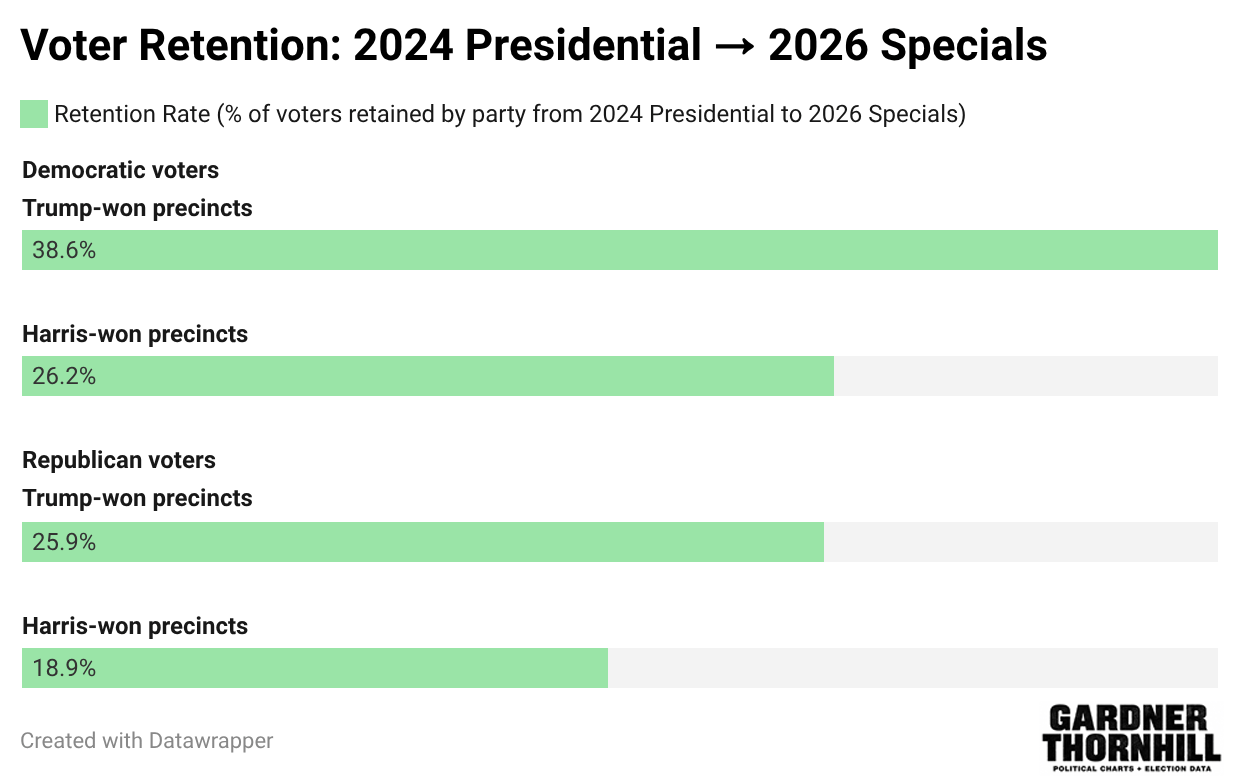
The pattern across 2,400+ precincts is clear: in special elections this year, Democratic voters are returning at higher rates than Republican voters, regardless of where you look.
In precincts that Trump won in 2024, Democratic voters returned at a rate of 38.6%. Republican voters in those same precincts returned at only 25.9%. That’s a 12.7 percentage point retention gap inside Trump-won territory. Democrats are showing up where they were outnumbered.
In Harris-won precincts, both parties retain at lower rates, but the gap still favors Democrats: 26.2% retention vs 18.9% for Republicans. A 7.3 point gap.
The asymmetry is biggest where it matters most. In the precincts Trump won, Democrats are outperforming their 2024 turnout by a wider margin than Republicans are. That’s the engine driving the Democratic flips we’ve seen in 2026 specials. The Republican coalition that delivered Trump’s win in 2024 simply isn’t turning out for the down-ballot races.
The Size of The Shifts
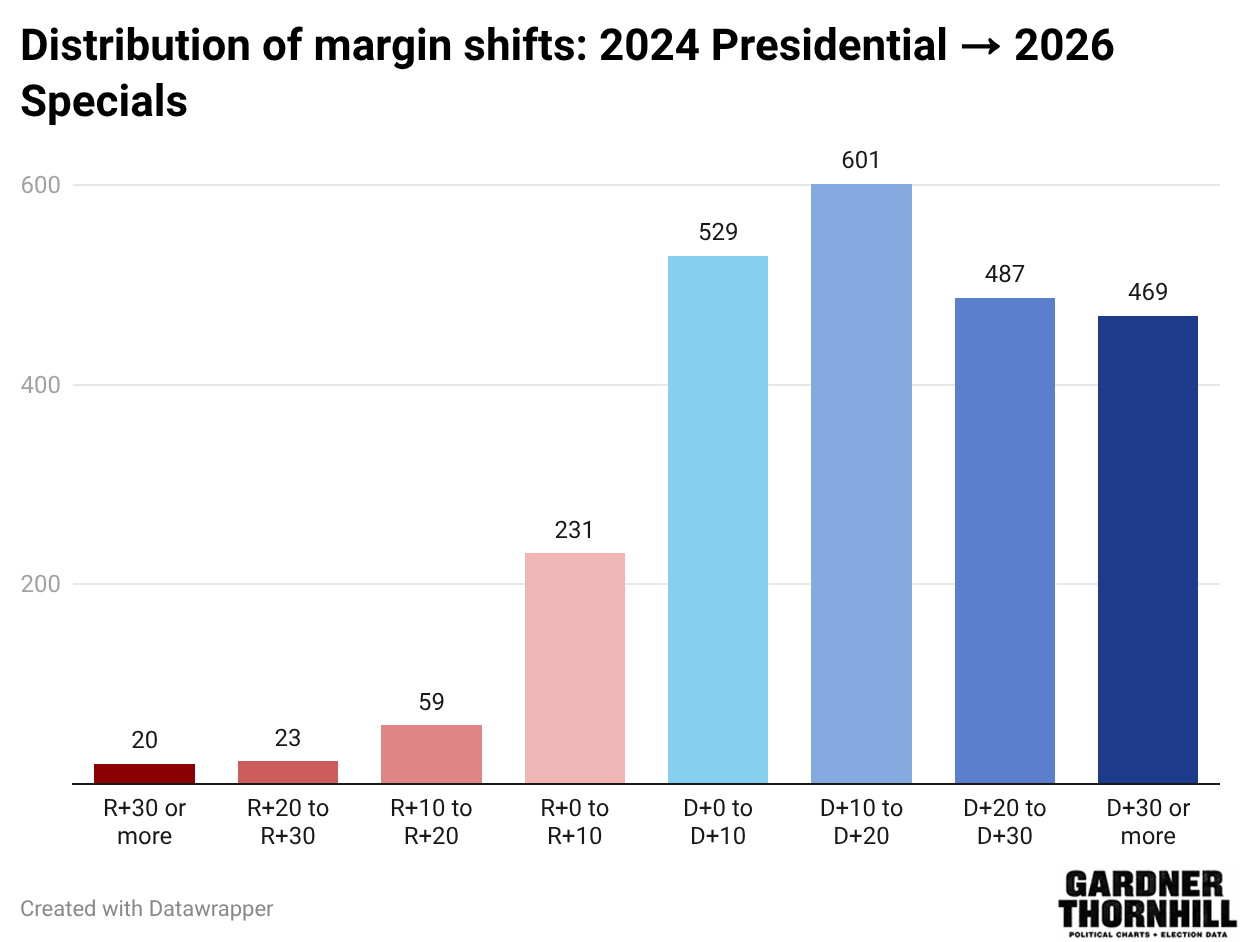
The buckets in this chart measure the change in margin between 2024 and 2026, not the final margin. A precinct in the “D+10 to D+20” bucket is one whose margin moved 10-20 points in the Democratic direction.
Across 2,400+ precincts, 86% shifted Democratic. Only 14% shifted to the Republicans. The size of the Democratic shifts is distributed pretty evenly across all of the buckets, with D+10-20% being the most common shift across the entire set.
The few precincts that shifted to the Republicans did not have the same spread. The few precincts in the entire set that shifted to the right in the 2026 Special Election I tracked mostly shifted by under 10% to the Republicans.
With numbers like these, it’s not too surprising that Democrats have flipped seats that Trump won by a healthy margin in 2024. With the next special election in Maine HD9 occurring in a few weeks (Trump won HD9 by 28.1% in 2024), it will be fascinating to see how close the Democratic Party can come to flipping this seat.
What this means for November?
I feel confident about the analysis across ~2,400 precincts, but it is important to note the limitations of the dataset and understand that this should not be used to make concrete predictions about the midterms.
Comparing Special Election precincts to General Election precincts can have its issues, and I’ve discovered more than a few times that precincts were split or had vastly different voter registration stats compared to their previous elections (not just voter maintenance). In those instances, I flagged the precincts, and they are not included in this study. As a result, some elections needed to be thrown out entirely.
This set is limited to the 2026 Special Elections and only to those for which I had precinct information. When you see people reference average Special Election performance, they are usually comparing every special election for the cycle at the district level.
With that being said, the data speaks for itself and confirm what we are seeing in the Generic Ballot (D+7.3) currently and lines up with Democrats being more motivated to vote and more engaged, which will help them in the midterms as poll after poll shows Democrats are more motivated to vote than Republicans and when midterm elections have less turnout than Presidential elections, the effect will only be more magnified.
Download the precinct dataset (CSV)
First published on Substack. Republished here in full.
About the author: Gardner Thornhill is an analytics engineer and data analyst who builds data pipelines, predictive models, and interactive visualizations. Explore his case studies and other articles.