work / 01 of 07 / civic technology
Where Do I Vote MS
Seven days before Election Day, I launched a nonpartisan polling place finder for Mississippi. It helped 11,352 people find where to vote, reaching every county in the state.
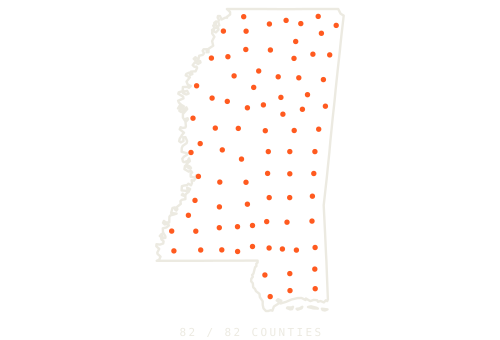
County centers, not individual lookup locations.
Launched seven days out.
Reached all 82 counties.
October 27–November 7, 2026. First-party event logs; visitor counts use anonymous browser IDs. Reach includes 1,445 of 1,731 precincts.
The problem
Mississippi voters needed a reliable answer to a simple question: where do I go? More than 100 precincts had changed polling places, and the state's official report still contained wrong or missing addresses. Going to last year's location could mean a wasted trip.
MS Engaged needed one link it could send by text, especially to people who vote infrequently. I designed around the phone: enter a home address, get a polling place, and see what to do next. No name, birth date, or voter ID number required.
I built the whole path
I owned the product, visual design, data pipeline, address matching, front end, back end, and measurement. I built and launched the site in under two days: a prototype on October 26, live the next afternoon, then shipped more than 15 production updates over eight days as partner corrections and voter needs came in.
The search sits inside a Mississippi welcome-sign design. Results show the polling place, a map, directions, voting hours, ID information, and the county clerk's number. Changed locations get a prominent alert. Unconfirmed locations get a clear route to verification.
- A voting-plan flow offered calendar reminders, a pledge, and a way to share with friends.
- A plain-language ballot explainer helped visitors understand the offices on their ballot and find a sample ballot.
- An absentee mode located 92 circuit clerk offices across the state's 82 counties, then switched back when in-person absentee voting ended.
- A private staff dashboard tracked the funnel, county and precinct reach, traffic sources, and experiments.
Turn messy data into a dependable answer
I parsed the state's 159-page polling-place PDF by column position and reconciled it against the state voter file, matching all 1,731 precincts with no disagreements in active-voter counts. I layered in 25 hand-checked corrections from the Mississippi Free Press's statewide audit and partner reports.
From roughly 966,000 registered addresses, I built a street guide: runs of house numbers associated with a precinct. Census blocks became precinct polygons for addresses on streets the guide did not cover. A shared address normalizer handled abbreviations, road forms, units, and typos; the Python and JavaScript versions agreed in all 9.4 million parity checks.
The street guide runs in the browser. When a match needs checking, the Census Geocoder and precinct polygons provide a second route. Ambiguous addresses trigger a choice or a referral to the official lookup. The site's event log stores neither typed addresses nor IP addresses.
Test the answer, including when to ask
Before launch, I tested against the precinct assignments in the voter file. Full-address tests were 99.9% correct across 2,000 registered voters. With 19,089 addresses held out of the guide to simulate new movers on known streets, 98.0% were correct.
The harder cases shaped the product. On 890 held-out streets, 82.7% were correct and 2.9% were wrong; the rest prompted clarification or directed the voter to the state lookup. When a user omitted both city and ZIP, the test returned no wrong answers: 77.7% resolved, and the remainder were asked to choose a town.
In production, 11,825 people searched and 11,352 got their polling place. These figures measure successful delivery of an answer; the accuracy figures come from the separate pre-launch tests. Rural route boxes and some roads spanning county lines remained known gaps.
Measure, then change the experience
With 93% of visitors on phones, I replaced a buried Facebook share prompt with the native share sheet and a direct question: “Who else needs to know where to vote?” The first experiment produced seven shares in the new flow and none in the control, so I rolled out the new version.
A later experiment compared showing the ballot explainer first with asking visitors to share first. Share-first produced a 5.1% share rate versus 2.5%; ballot-first produced 41% ballot-step completion versus 14%. The first screen determined what people did, so its order was a product decision with a measurable tradeoff.
By the end, 388 people shared the site. Those shares brought 392 visitors, and 241 of them found their polling place. Another 1,320 visitors opened a sample ballot, 518 added voting to their calendar, and 2,535 checked their voter status on a partner site.
The result
The tool reached all 82 Mississippi counties and 83% of precincts. Election Day accounted for 8,009 successful lookups, with 1,459 in the busiest hour. In the final hour before polls closed, 304 people still used it to find where to go.
This project brought together the work I care about: making public data usable, building an experience people can understand on a phone, and measuring whether it actually answers their question. For the next cycle, I would launch earlier, give partners more time to distribute the link, and measure where people leave each step of the follow-up flow.