work / 02 of 06 / live tool
NYC Poll Tracker
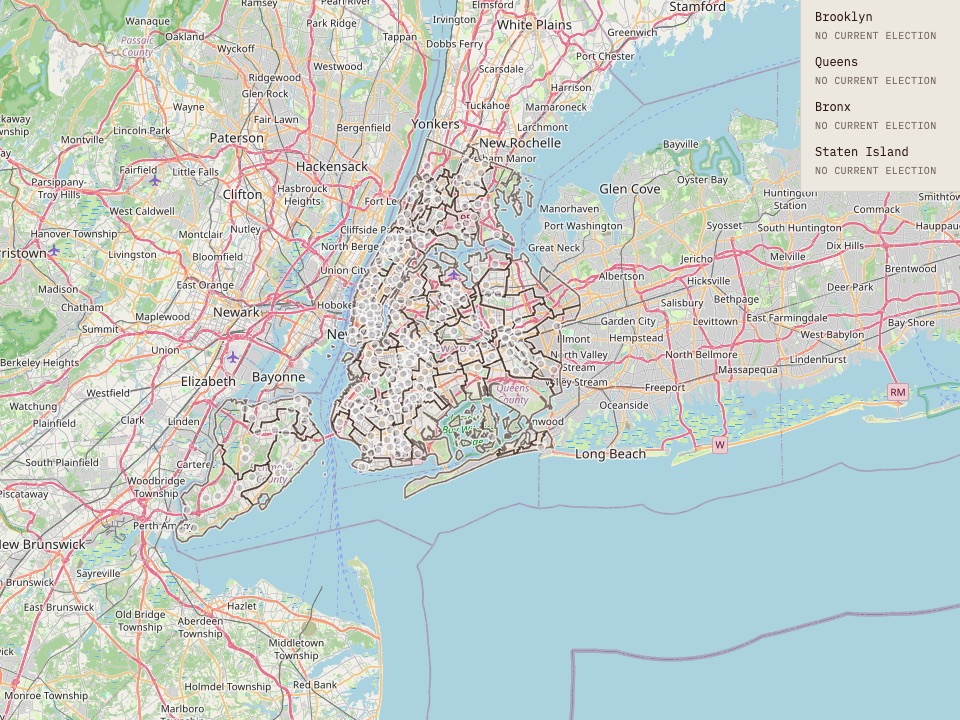
A live election-day site that tracked wait times at every polling place in New York City during the 2025 mayoral primary and rolled them up to the districts that matter.
What it does
The tracker ingests New York City's live polling-place API, updates wait times across every site in the five boroughs, and groups those signals at six levels: Election District, Assembly District, City Council, State Senate, Congressional District, and borough.
It also layers in political analyst Michael Lange's Assembly-level prediction map, so the live operational picture sits next to expert local knowledge about where turnout was expected to be strong.
How it is used
On primary day a long wait is an operational signal, not just a public-information issue. Voter-assistance volunteers, legal observers, and troubleshooting support can be routed toward the sites and districts where friction is highest.
Because the tool rolls sites up to political districts, a decision-maker can see in one glance whether a problem is isolated to one location or concentrated in a district that matters.
What I built
- Python ingestion and processing against the city's live polling-place feed, resilient to the gaps and oddities of a live API.
- Geographic joins from each polling site to its Election District and up through Assembly, Senate, Council, Congressional, and borough boundaries.
- A JavaScript front end on Leaflet with a layer switcher per district level, a wait-time legend, and a borough summary panel.
- Deployed and live while voting was underway. This was production work, not a demo, and it generated more than 100,000 combined views across the web and social media.